AITB International Conference, 2019
Kathmandu, Nepal

My Youtube Channel
Please Subscribe

Flag of Nepal
Built in OpenGL

World Covid-19 Data Visualization
Choropleth map

Word Cloud in Python
With masked image
Tuesday, August 25, 2020
Monday, August 24, 2020
Saturday, August 22, 2020
Wednesday, August 19, 2020
Sunday, August 16, 2020
Various features of Markdown in Jupyter Notebook

Output of Emphasis:


Output of List:


Output of Links:

Output of Images:


Output of table:


Output of Blockquotes:


Output of Horizontal Rule:


Output of Youtube links:


Output of Headers:

Get the Github link here.
Web scrapping using a single line of code in python
We will scrap the data of wikipedia using a single line of code in python. No extra libraries are required. Only Pandas can do the job.
Step 1: Install and import pandas library
import numpy as np
Step 2: Read the data of web (here Wikipedia website) using pd.read_html('Website link here')[integer]
df = pd.read_html('https://en.wikipedia.org/wiki/COVID-19_pandemic_by_country_and_territory')[1]
Step 3: View the data scrapped from the web

Step 4: In case there are multiple table within a web page, you can change the index value to an integer starting from 0 until you get your required data (i.e. [0] or [1] or [2] or [3] and so on).
Build a colorful Word Cloud in python using mask image
Word cloud is a data visualization tool in data science. It is very efficient to visualize various words in a text according to the quantum of their repetition within the text. The stopwords have been ignored while visualization. A text file called "skill.txt" has been used to visualize. Mask image of map of Nepal has been used to visualize the word cloud.
The libraries required are:


Reading the text file "alice.txt" whose word cloud will be formed. After reading text file, setting the stopwords.

Generating a word cloud and storing it into "skillwc" variable.

Importing libraries and creating a simple image of word cloud (without using mask image).


Now, using mask image of map of Nepal to create word cloud. First of all, we will open the image and save it in a variable "mask_image" and then view the mask image without superimposing the text onto it.


Click here to download the collection of mask image.
Finally, we will impose the text file 'alice.txt' onto the image shown above with adding original color of image to the word cloud instead of default color.


Get the Github link here.
Friday, August 14, 2020
Covid-19 Data Visualization across the World using Choropleth map
Introduction
This project visualizes the Covid-19 data (i.e. Total cases, Deaths and Recoveries) across various Provinces and Districts of Nepal as of 12th August, 2020. Geojson file of Nepal's states and districts have been used. Also python library i.e. Folium has been used to generate Choropleth map whose geo_data value is the geojson of Nepal.
The libraries imported are:

Data description:
Covid-19 data of Countries across the world were scrapped from wikipedia.
Click here to go to the wikipedia page.
Simple one line code can be used to scrap the table of wikipedia. We will store the scrapped data into a dataframe called 'df'.
df = pd.read_html('https://en.wikipedia.org/wiki/COVID-19_pandemic_by_country_and_territory')[1]
View of original data:

Data Wrangling/ Cleaning:
Step 1:
Selecting only required columns into new dataframe df1 from the data above.

Step 2:
Converting the multi-index column into single-index colums.

Step 3:
Removing the index attached with the name of each countries in the dataframe above.
df1['Countries'] = df1['Countries'].str.replace(r'\[.*?\]$', '')

Changing the country name 'United States' to 'United States of America' to match with the name in Geojson file.
df1['Countries'].replace('United States', 'United States of America', inplace=True)


Visualizing the data across world:


Get the Github link here.
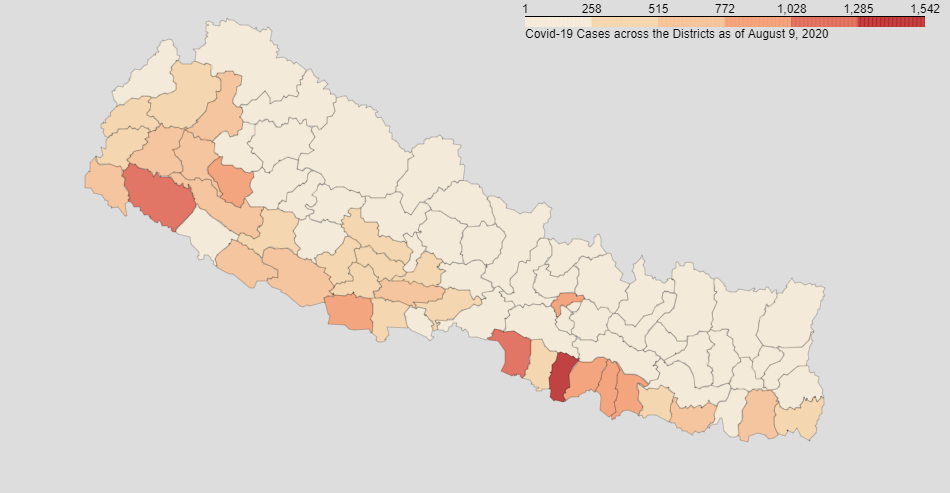
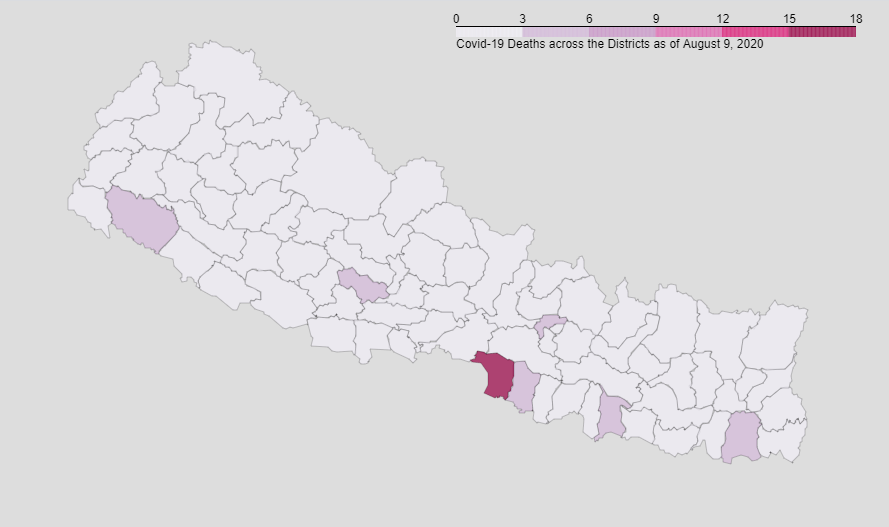
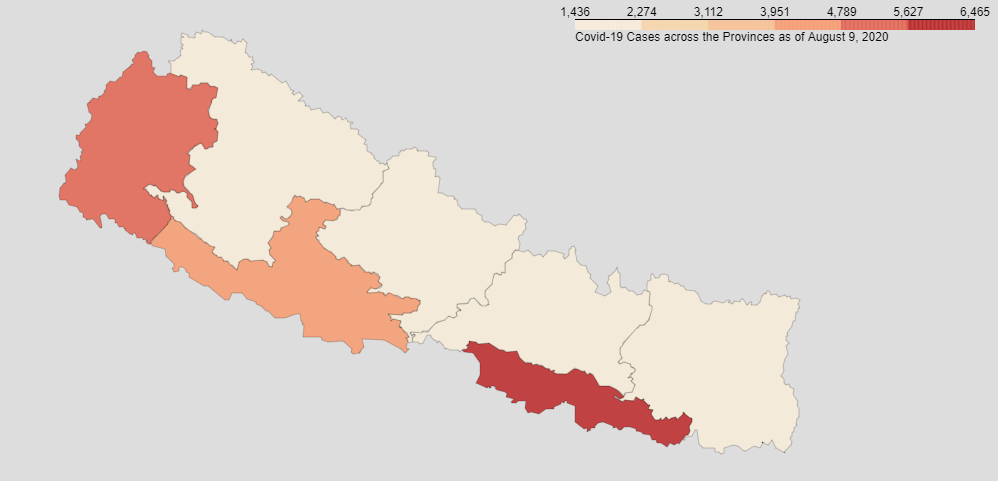
Covid-19 Data Visualization of Nepal using Choropleth map
Introduction
This project visualizes the Covid-19 data (i.e. Total cases, Deaths and Recoveries) across various Provinces and Districts of Nepal as of 9th August, 2020. Geojson file of Nepal's states and districts have been used. Also python library i.e. Folium has been used to generate Choropleth map whose geo_data value is the geojson of Nepal.
The libraries imported are:

Data description:
Covid-19 data of various provinces and districts were scrapped from wikipedia.
Click here to go to the wikipedia page.
Simple one line code can be used to scrap the table of wikipedia. We will store the scrapped data into a dataframe called 'df'.
df = pd.read_html('https://en.wikipedia.org/wiki/Template:COVID-19_pandemic_data/Nepal_medical_cases_by_province_and_district')[1]
Original view of data:

Data Wrangling/ Cleaning:
Step 1:
We can see in data above that the columns are of multi-index. So, converting it into single index columns.

Step 2:
Dropping the 'Index Case column'.
df.drop(columns=['Index Case'], axis=1, inplace=True)
Step 3:

We can see the rows with index 84 (it's a grand total case in Nepal) and 85 are not required so dropping them out.
df=df[:-2] # Getting all rows except the last two rows
Step 4:

We can see in above image that the data types of columns Cases, Recovered and Deaths are not in desired form. So, converting them into 'integer'.

Step 5:
Our dataframe (df) after cleaning looks like this:

We can see the data of Provinces and Districts are together in single dataframe. So, we need to separate them into different dataframes.
Creating a dataframe of Provinces only:
Step 1:
Extracting the data of only provinces into a new dataframe called df_prov.
We can use two methods to do so.
Method 1
#df_prov=df.iloc[[0, 15, 24, 38, 50, 63, 74],:]
Method 2 (More robust method as in above method the index of provinces may change in original link of data)
df_prov=df[df['Location'].str.contains('Province') | df['Location'].str.contains('Bagmati') | df['Location'].str.contains('Gandaki') | df['Location'].str.contains('Karnali') | df['Location'].str.contains('Sudurpashchim') ]


Visualizing the data of provinces:


Creating a dataframe of districts only:

Visualizing data of districts: