Introduction
This project visualizes the Covid-19 data (i.e. Total cases, Deaths and Recoveries) across various Provinces and Districts of Nepal as of 9th August, 2020. Geojson file of Nepal's states and districts have been used. Also python library i.e. Folium has been used to generate Choropleth map whose geo_data value is the geojson of Nepal.
The libraries imported are:
Data description:
Covid-19 data of various provinces and districts were scrapped from wikipedia.
Click here to go to the wikipedia page.
Simple one line code can be used to scrap the table of wikipedia. We will store the scrapped data into a dataframe called 'df'.
df = pd.read_html('https://en.wikipedia.org/wiki/Template:COVID-19_pandemic_data/Nepal_medical_cases_by_province_and_district')[1]
Original view of data:
Data Wrangling/ Cleaning:
Step 1:
We can see in data above that the columns are of multi-index. So, converting it into single index columns.
Step 2:
Dropping the 'Index Case column'.
df.drop(columns=['Index Case'], axis=1, inplace=True)
Step 3:
We can see the rows with index 84 (it's a grand total case in Nepal) and 85 are not required so dropping them out.
df=df[:-2] # Getting all rows except the last two rows
Step 4:
We can see in above image that the data types of columns Cases, Recovered and Deaths are not in desired form. So, converting them into 'integer'.
Step 5:
Our dataframe (df) after cleaning looks like this:
We can see the data of Provinces and Districts are together in single dataframe. So, we need to separate them into different dataframes.
Creating a dataframe of Provinces only:
Step 1:
Extracting the data of only provinces into a new dataframe called df_prov.
We can use two methods to do so.
Method 1
#df_prov=df.iloc[[0, 15, 24, 38, 50, 63, 74],:]
Method 2 (More robust method as in above method the index of provinces may change in original link of data)
df_prov=df[df['Location'].str.contains('Province') | df['Location'].str.contains('Bagmati') | df['Location'].str.contains('Gandaki') | df['Location'].str.contains('Karnali') | df['Location'].str.contains('Sudurpashchim') ]
Step 2:
Resetting the index of newly formed dataframe.
df_prov.reset_index(drop=True, inplace=True)
View of new dataframe:
Creating a copy of this dataframe to use it while creating a dataframe for districts.
df_backup=df_prov.copy()
Step 4:
Renaming the Provinces to match them with the name of Provinces mentioned in Geojson file of Nepal.
Step 5:
Renaming the column 'Location' to 'Province'.
df_prov.rename(columns={'Location':'Province'}, inplace=True)
Final view of dataframe of Provinces:
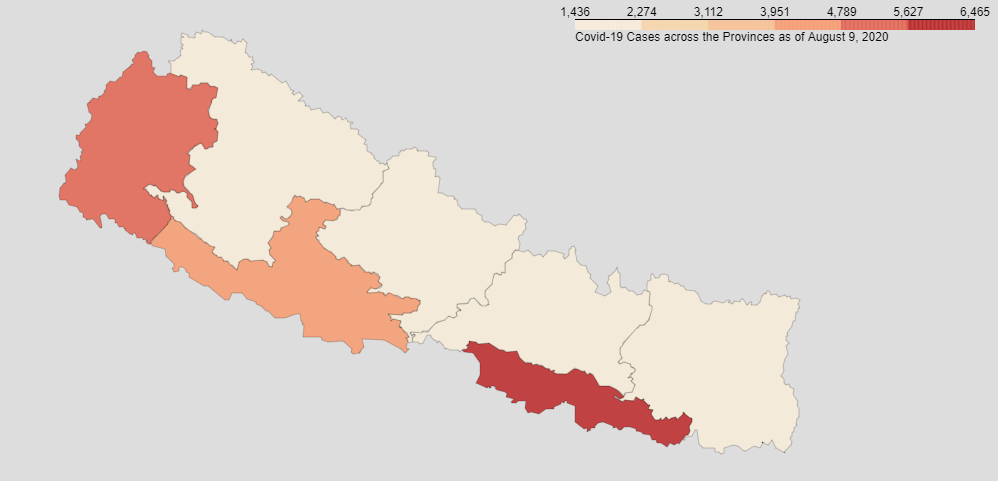
Visualizing the data of provinces:
For Cases
Reading the Geojson file and creating a plain map of Nepal:
Defining a Choropleth map in a plain map created above:
Map of Nepal as seen for Cases in various Provinces:
Similarly, we can visualize map for Recovered and Deaths in various Provinces of Nepal as follow:
Map for recovered:
Map for deaths:
Creating a dataframe of districts only:
1. Creating a new dataframe for districts called 'df_dist' by concatenating dataframes df and df_prov, and removing the duplicates rows between them.
df_dist=pd.concat([df, df_backup]).drop_duplicates(keep=False)
2. Renaming the column 'Location' to 'District'.
df_dist.rename(columns={"Location":"District"}, inplace=True)
3. Resetting the index of dataframe df_dist.
df_dist.reset_index(drop=True, inplace=True)
4. Final dataframe of districts i.e. df_dist looks like this:

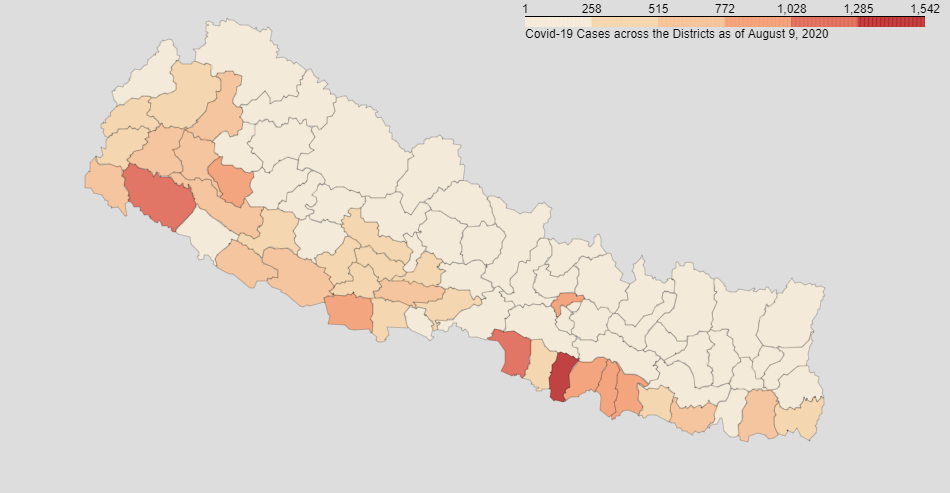
Visualizing data of districts:
For cases:
Map for cases:
Map for recovered:
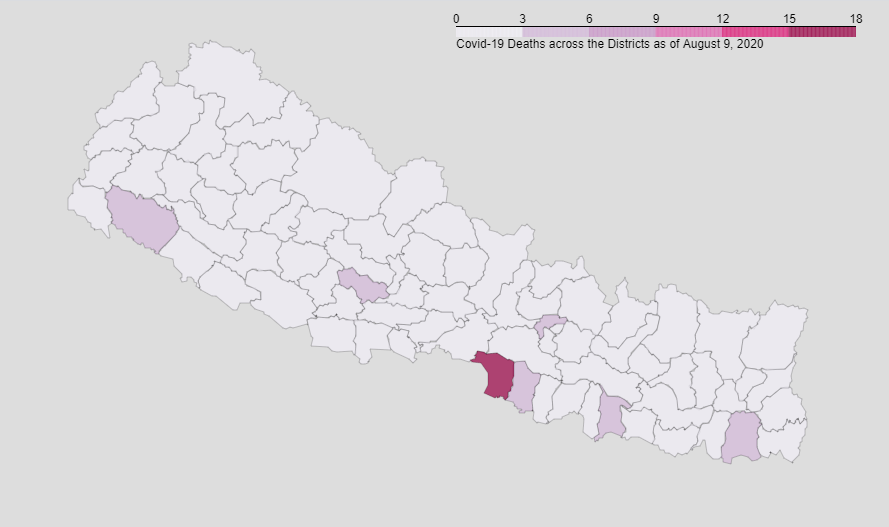
Map for deaths:
Get the Github link here.