AITB International Conference, 2019
Kathmandu, Nepal
My Youtube Channel
Please Subscribe
Flag of Nepal
Built in OpenGL
World Covid-19 Data Visualization
Choropleth map
Word Cloud in Python
With masked image
Sunday, August 16, 2020
Friday, August 14, 2020
Covid-19 Data Visualization across the World using Choropleth map
Introduction
This project visualizes the Covid-19 data (i.e. Total cases, Deaths and Recoveries) across various Provinces and Districts of Nepal as of 12th August, 2020. Geojson file of Nepal's states and districts have been used. Also python library i.e. Folium has been used to generate Choropleth map whose geo_data value is the geojson of Nepal.
The libraries imported are:
Data description:
Covid-19 data of Countries across the world were scrapped from wikipedia.
Click here to go to the wikipedia page.
Simple one line code can be used to scrap the table of wikipedia. We will store the scrapped data into a dataframe called 'df'.
df = pd.read_html('https://en.wikipedia.org/wiki/COVID-19_pandemic_by_country_and_territory')[1]
View of original data:
Data Wrangling/ Cleaning:
Step 1:
Selecting only required columns into new dataframe df1 from the data above.
Step 2:
Converting the multi-index column into single-index colums.
Step 3:
Removing the index attached with the name of each countries in the dataframe above.
df1['Countries'] = df1['Countries'].str.replace(r'\[.*?\]$', '')
Step 4:Changing the country name 'United States' to 'United States of America' to match with the name in Geojson file.
df1['Countries'].replace('United States', 'United States of America', inplace=True)
Visualizing the data across world:
Get the Github link here.
Covid-19 Data Visualization of Nepal using Choropleth map
Introduction
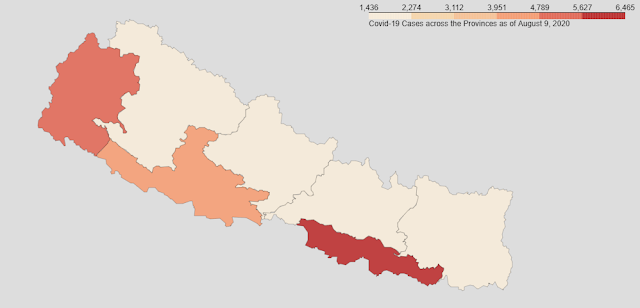
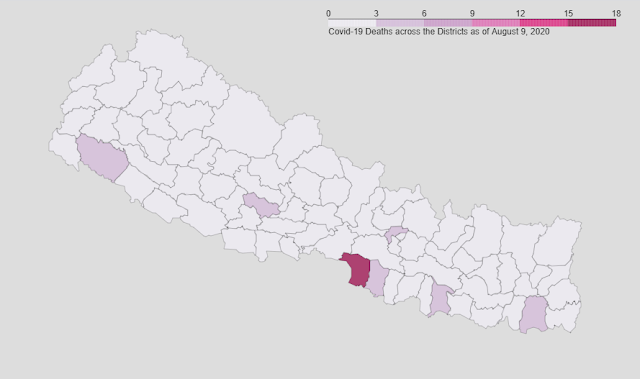
This project visualizes the Covid-19 data (i.e. Total cases, Deaths and Recoveries) across various Provinces and Districts of Nepal as of 9th August, 2020. Geojson file of Nepal's states and districts have been used. Also python library i.e. Folium has been used to generate Choropleth map whose geo_data value is the geojson of Nepal.
The libraries imported are:
Data description:
Covid-19 data of various provinces and districts were scrapped from wikipedia.
Click here to go to the wikipedia page.
Simple one line code can be used to scrap the table of wikipedia. We will store the scrapped data into a dataframe called 'df'.
df = pd.read_html('https://en.wikipedia.org/wiki/Template:COVID-19_pandemic_data/Nepal_medical_cases_by_province_and_district')[1]
Original view of data:
Data Wrangling/ Cleaning:
Step 1:
We can see in data above that the columns are of multi-index. So, converting it into single index columns.
Step 2:
Dropping the 'Index Case column'.
df.drop(columns=['Index Case'], axis=1, inplace=True)
Step 3:
We can see the rows with index 84 (it's a grand total case in Nepal) and 85 are not required so dropping them out.
df=df[:-2] # Getting all rows except the last two rows
Step 4:
We can see in above image that the data types of columns Cases, Recovered and Deaths are not in desired form. So, converting them into 'integer'.
Step 5:
Our dataframe (df) after cleaning looks like this:
We can see the data of Provinces and Districts are together in single dataframe. So, we need to separate them into different dataframes.
Creating a dataframe of Provinces only:
Step 1:
Extracting the data of only provinces into a new dataframe called df_prov.
We can use two methods to do so.
Method 1
#df_prov=df.iloc[[0, 15, 24, 38, 50, 63, 74],:]
Method 2 (More robust method as in above method the index of provinces may change in original link of data)
df_prov=df[df['Location'].str.contains('Province') | df['Location'].str.contains('Bagmati') | df['Location'].str.contains('Gandaki') | df['Location'].str.contains('Karnali') | df['Location'].str.contains('Sudurpashchim') ]
Visualizing the data of provinces:
Creating a dataframe of districts only:
Visualizing data of districts:
Get the Github link here.
Thursday, August 6, 2020
Monday, July 27, 2020
Data Science Capstone project - The battle of neighborhoods in Dubai
1.
Introduction/ Business understanding
1.1
Description of problem
Recently,
the 13th edition of IPL (Indian Premier League) has been announced
amid coronavirus pandemic and UAE has been chosen as the host country. The
league is slated to commence from 19th of September, 2020. There has
been ongoing discussion regarding the entry of audience in the stadium. The
dataset of Dubai has been used to help the visitors of Dubai find places
suitable for restaurant, hotel and so on during the IPL season.
1.2 Background of problem
Indian Premier League (IPL) is one of the most popular and highly valued league across the world particularly within cricket playing nation like India, Australia, England and so on. It is an India’s version of T20 cricket league tournament. It gathers large audience in stadium and has huge viewership across cable TV and digital platform. Since, it is India’s tournament it is mostly played in India. But in some extra ordinary condition, it is played in some other countries. This time it is UAE. UAE is also a cricket playing nation and has similar time zone as of India. Many games are slotted to be played in the stadium of Dubai as well. Dubai is located in the eastern part of Arabian Peninsula on the coast of Persian Gulf. Dubai aims to be the business hub of western Asia. It is also a major global transport hub for passengers and cargo.
It is difficult for new travelers to find best place suited for them. So, using the foursquare API, I have performed various analysis on the data set of Dubai to find the best place for restaurant, hotels, parks and so on. This could help the new visitors of Dubai to get the overview of the places.
2. Data
description
The dataset
that used in this project is of Dubai scrapped from Wikipedia. This dataset
contains the list of 131 communities of Dubai.
Data source:
https://en.wikipedia.org/wiki/List_of_communities_in_Dubai
We scrapped
the data from the table of Wikipedia using a python library called ‘Beautiful
soup’. We will use only 3 columns of the dataset i.e. Community Number,
Community (English) and Community (Arabic).
Example of dataset:
I used
‘geopy’ library to find the latitude and longitude of each community. And then
using foursquare API I found the venues in each community and what is each
community famous for.
3.
Methodology
3.1 Scrapping table of list of communities of Dubai from
Wikipedia
3.2 Adding geospatial data
Using geopy library location i.e. latitude and longitude of each communities were retrieved. The communities whose location could not be found were left out. Hence, I was left with 65 communities out of 131.
The outlook of data after adding location:
3.3 Finding the venues of neighborhood within a radius of 500
meters using Foursquare API:
Defining
the credentials to connect to Foursquare API:
we can see a total of four venues were
returned by foursquare.
Exploring the venues of all 65 neighborhood of Dubai:
I
was having problem when trying to explore the venues of all 65 neighborhoods at
one go. So, what I did was I divided the 65 neighborhoods into 4 groups and
then explored the venues of each neighborhood separately. When the venues of
all four groups were returned, they were concatenated together.
The
data frame after concatenation along with venues of each neighborhood is as follow:
The
number of venues in each neighborhood returned by foursquare can be viewed as:
From
above table we can see Abu Hail has 4 venues, Al Baraha, Al Buteen, Al Garhoud
has 40 venues and so on.
Displaying each neighborhood with top 5 most
common venues:
From above figure, we can see the top 5 venues of Al Baraha are Hotel, Middle Eastern Restaurant, cafe, American Restaurant and Spa. The frequency above represents that among 100% venues in Al Baraha, 20% are Hotel, 20% are Middle Eastern Restaurant, 10% are Café, 10% are American restaurant, 10% are Spa and the remaining 30% are venues other than these.
The top 10 venues of each neighborhood
are displayed in below table:
Clustering
the neighborhoods i.e. communities of Dubai based on the similarities of their
venues using K- Means algorithm:
The
neighborhoods have been grouped into five clusters.
The
K-Means label for each neighborhood:
Now,
plotting each neighborhood into map using folium library:
Folium
is an essential library to visualize locations on a map. It also allows to zoom
in and zoom out the map. With very lines of code, it, does amazing piece of
work for visualization of data.
From the study of venues of each
neighborhood we got some results. Lets discuss those results here:
Finding 1:
As we are discussing about IPL going
to be held in UAE and being an Indian league tournament more Indians are
expected to visit this place. From above data we see plenty of Indian
restaurant available here. So, people from India will probably face no problem
finding the restaurant of their kind. Also, cricket is mainly considered an
Asian game. So, for people from across the Asia visiting the place can also
find plenty of Asian restaurant.
The places where one can find Indian restaurant easily are:
From above data, we can see Emirates
Hill Third, Marsa Dubai, Al Raffa, Al Karama are more famous for Indian
restaurant.
Finding 2:
Places where hotel can be found easily
are:
So, if someone in Dubai is looking for
place with more options available for hotel, they can choose from the places
above.
Finding 3:
Places with most parks are given
below:
So, people fond of parks can choose to stay in
the communities/ neighborhoods mentioned above.
Finding 4:
Someone fond of beach can choose to
stay in the given below:
Finding 5:
Many people love to have coffee
frequently and it becomes for them when they don’t find a coffee shop easily.
So, here are the list of places more famous for having coffee shops.
So, these were some findings which I
felt were more necessary to be known to people traveling to Dubai.
5. Conclusion
In today's time of digital world, data
science plays vital role. It increases the capability of the businesses,
medical instruments. It helps the businesses to analyze the behavior of their
customers, and also compete with their counterpart in a fast-changing world.
With an exponential increase in the use of digital instruments in various
sectors, lots of data are being generated and stored every day. Hence, it becomes quite instrumental and
essential to analyze those data to gain information which could help in the
improvement of various sectors by taking right decision at right time.
With this project I have made an
effort to help the first time travelers to Dubai especially during the season
of IPL. I have used some common libraries like geopy, folium to find the
location and plot those locations on map respectively. Also, I have made use of
foursquare API to explore the venues of each neighborhoods. Despite all these
efforts, there are still some areas of improvements which could help in providing
even more essential and realistic information from the data.


